Use visual exploration before drafting arguments
Chronology becomes more meaningful when you first see clusters, gaps, and overlaps.
Then, contextual and exact-year prompts can consolidate that map into durable retrieval.
Compare timelines for stronger global understanding
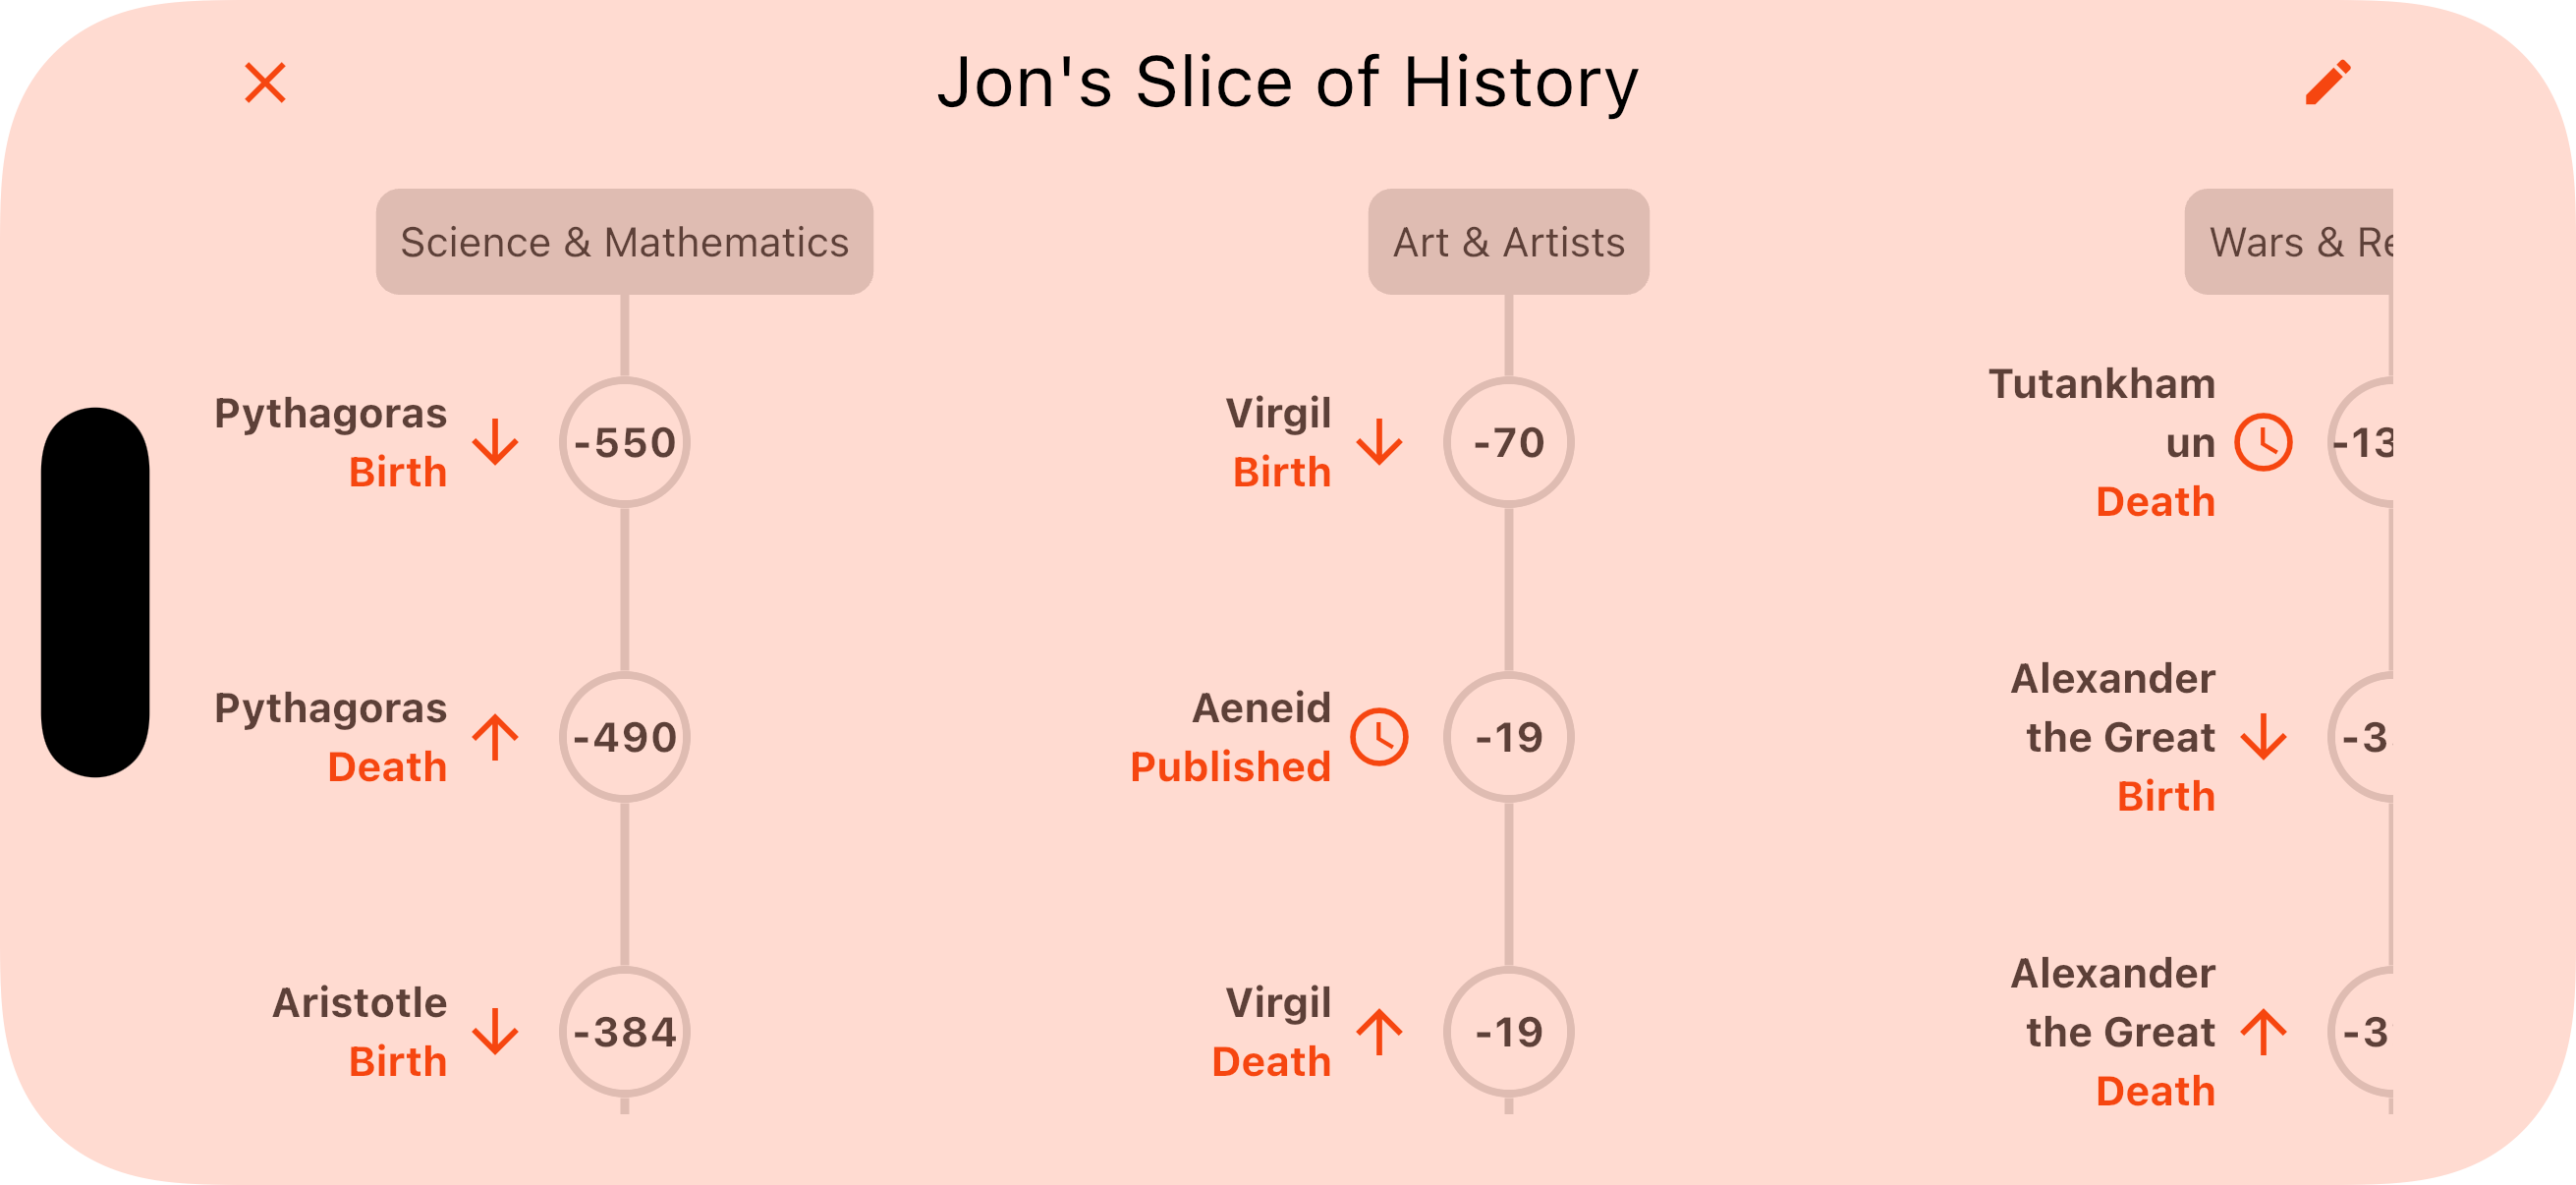
Comparing themes and regions helps you identify patterns, divergence, and interaction across eras.
This matters because comparative awareness strengthens Perspective and Significance analysis. It also strengthens memory.
Use visual exploration as active study
Treat visualisation as inquiry in action.
- Which developments overlap and might influence each other?
- Where do long term trends accelerate or stall?
- Which actors and conditions recur across multiple events?
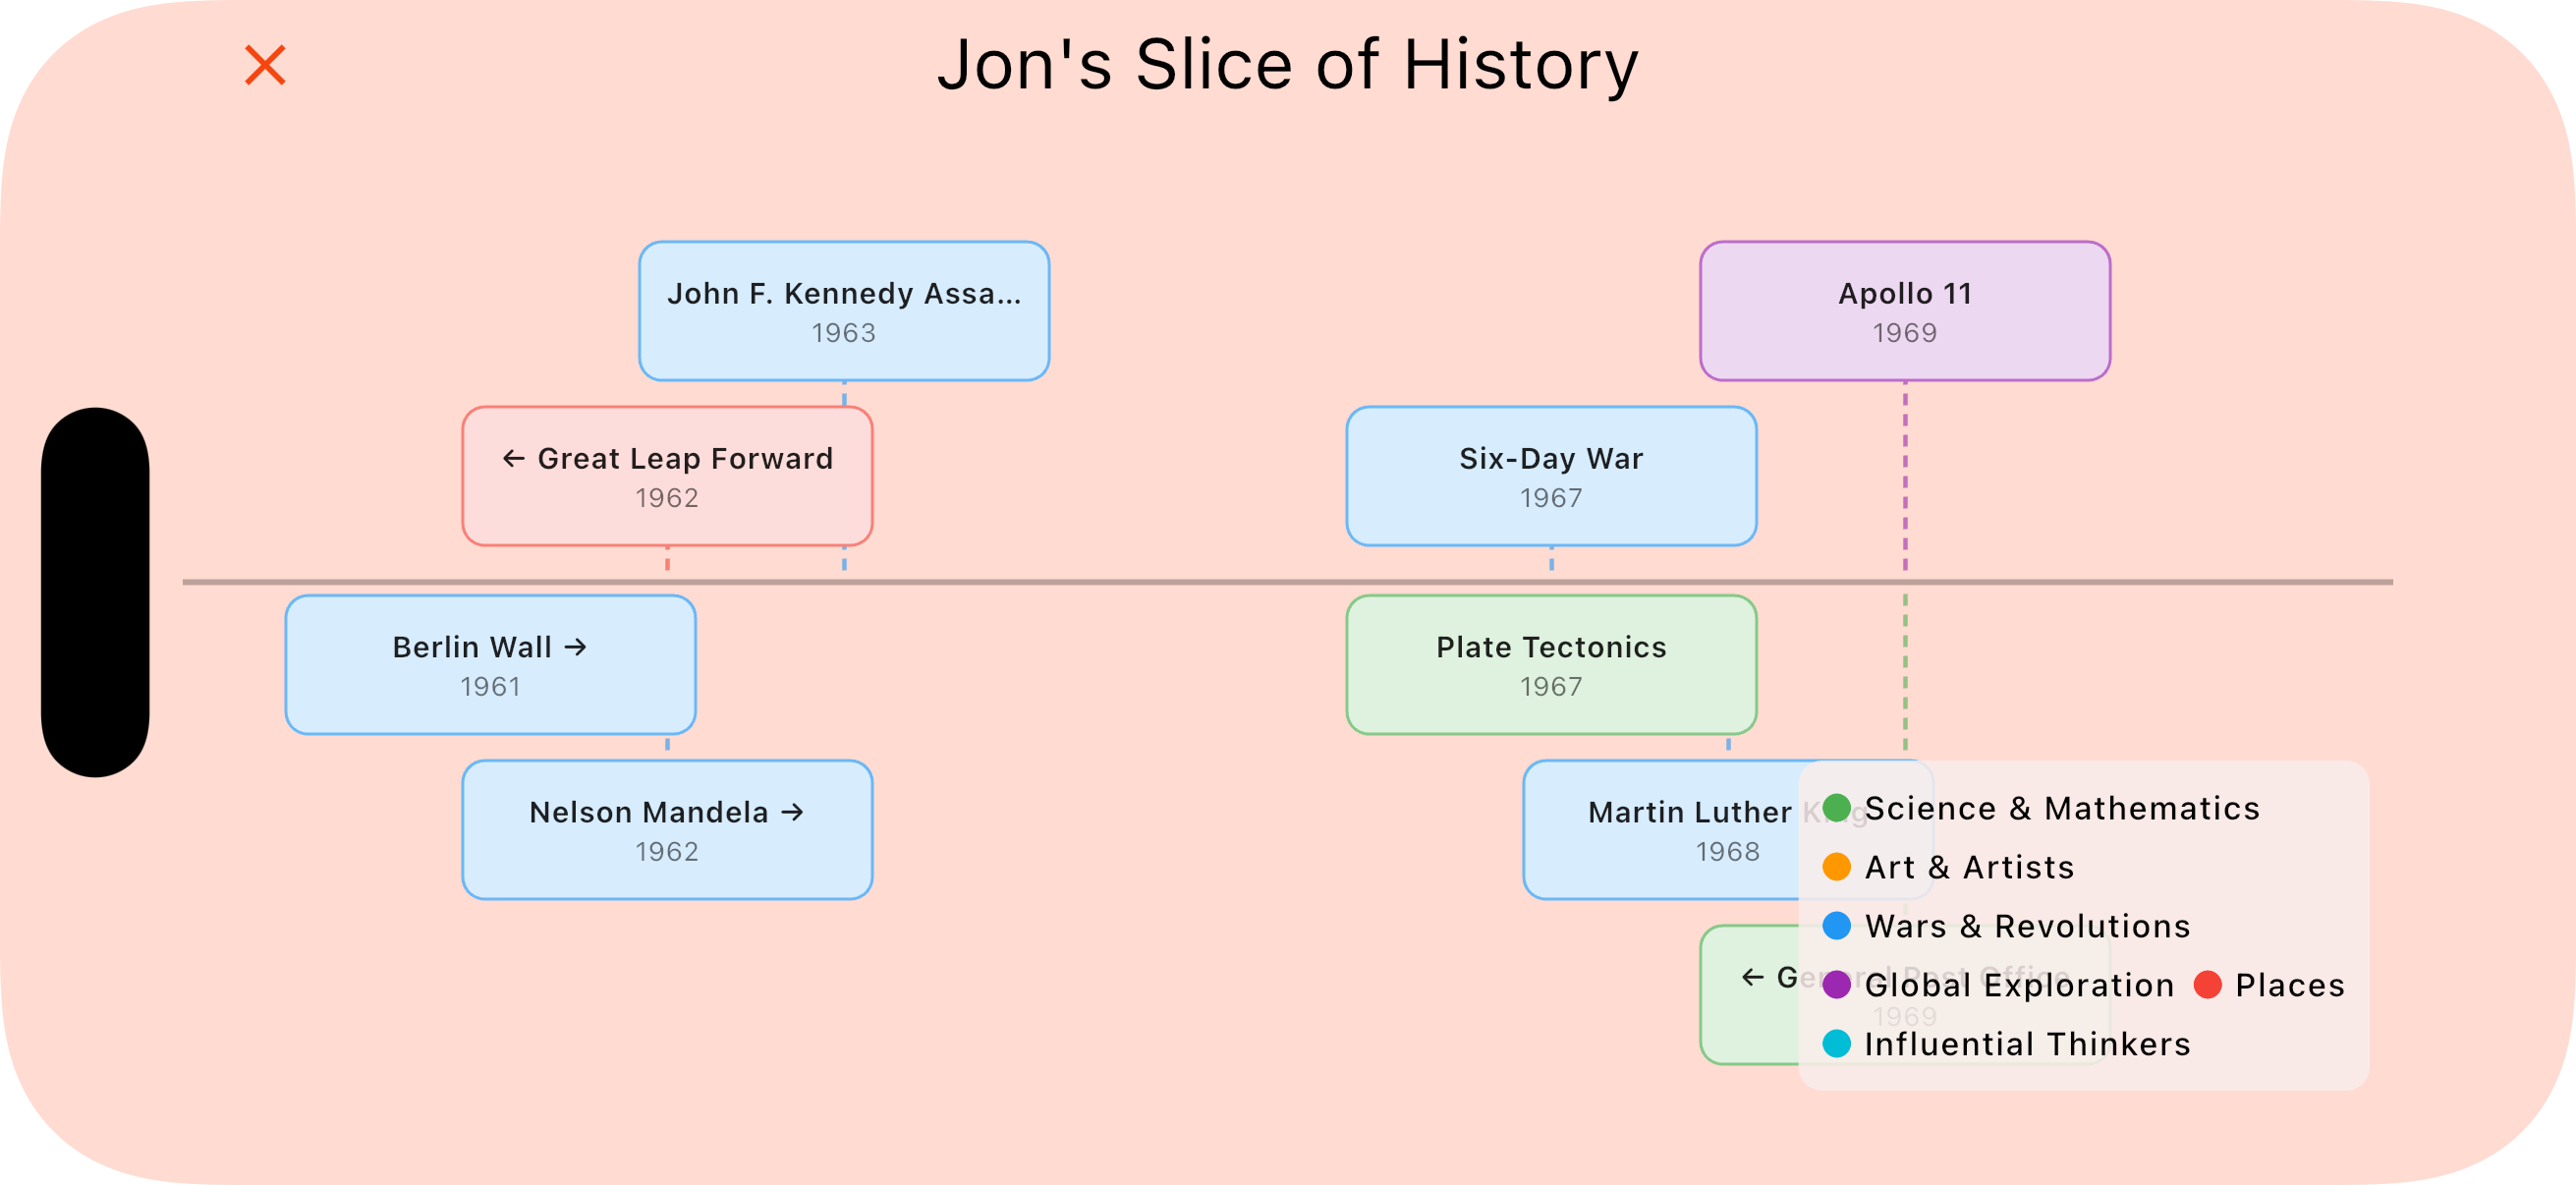
- What should be connected with the Link feature to model causal interplay?
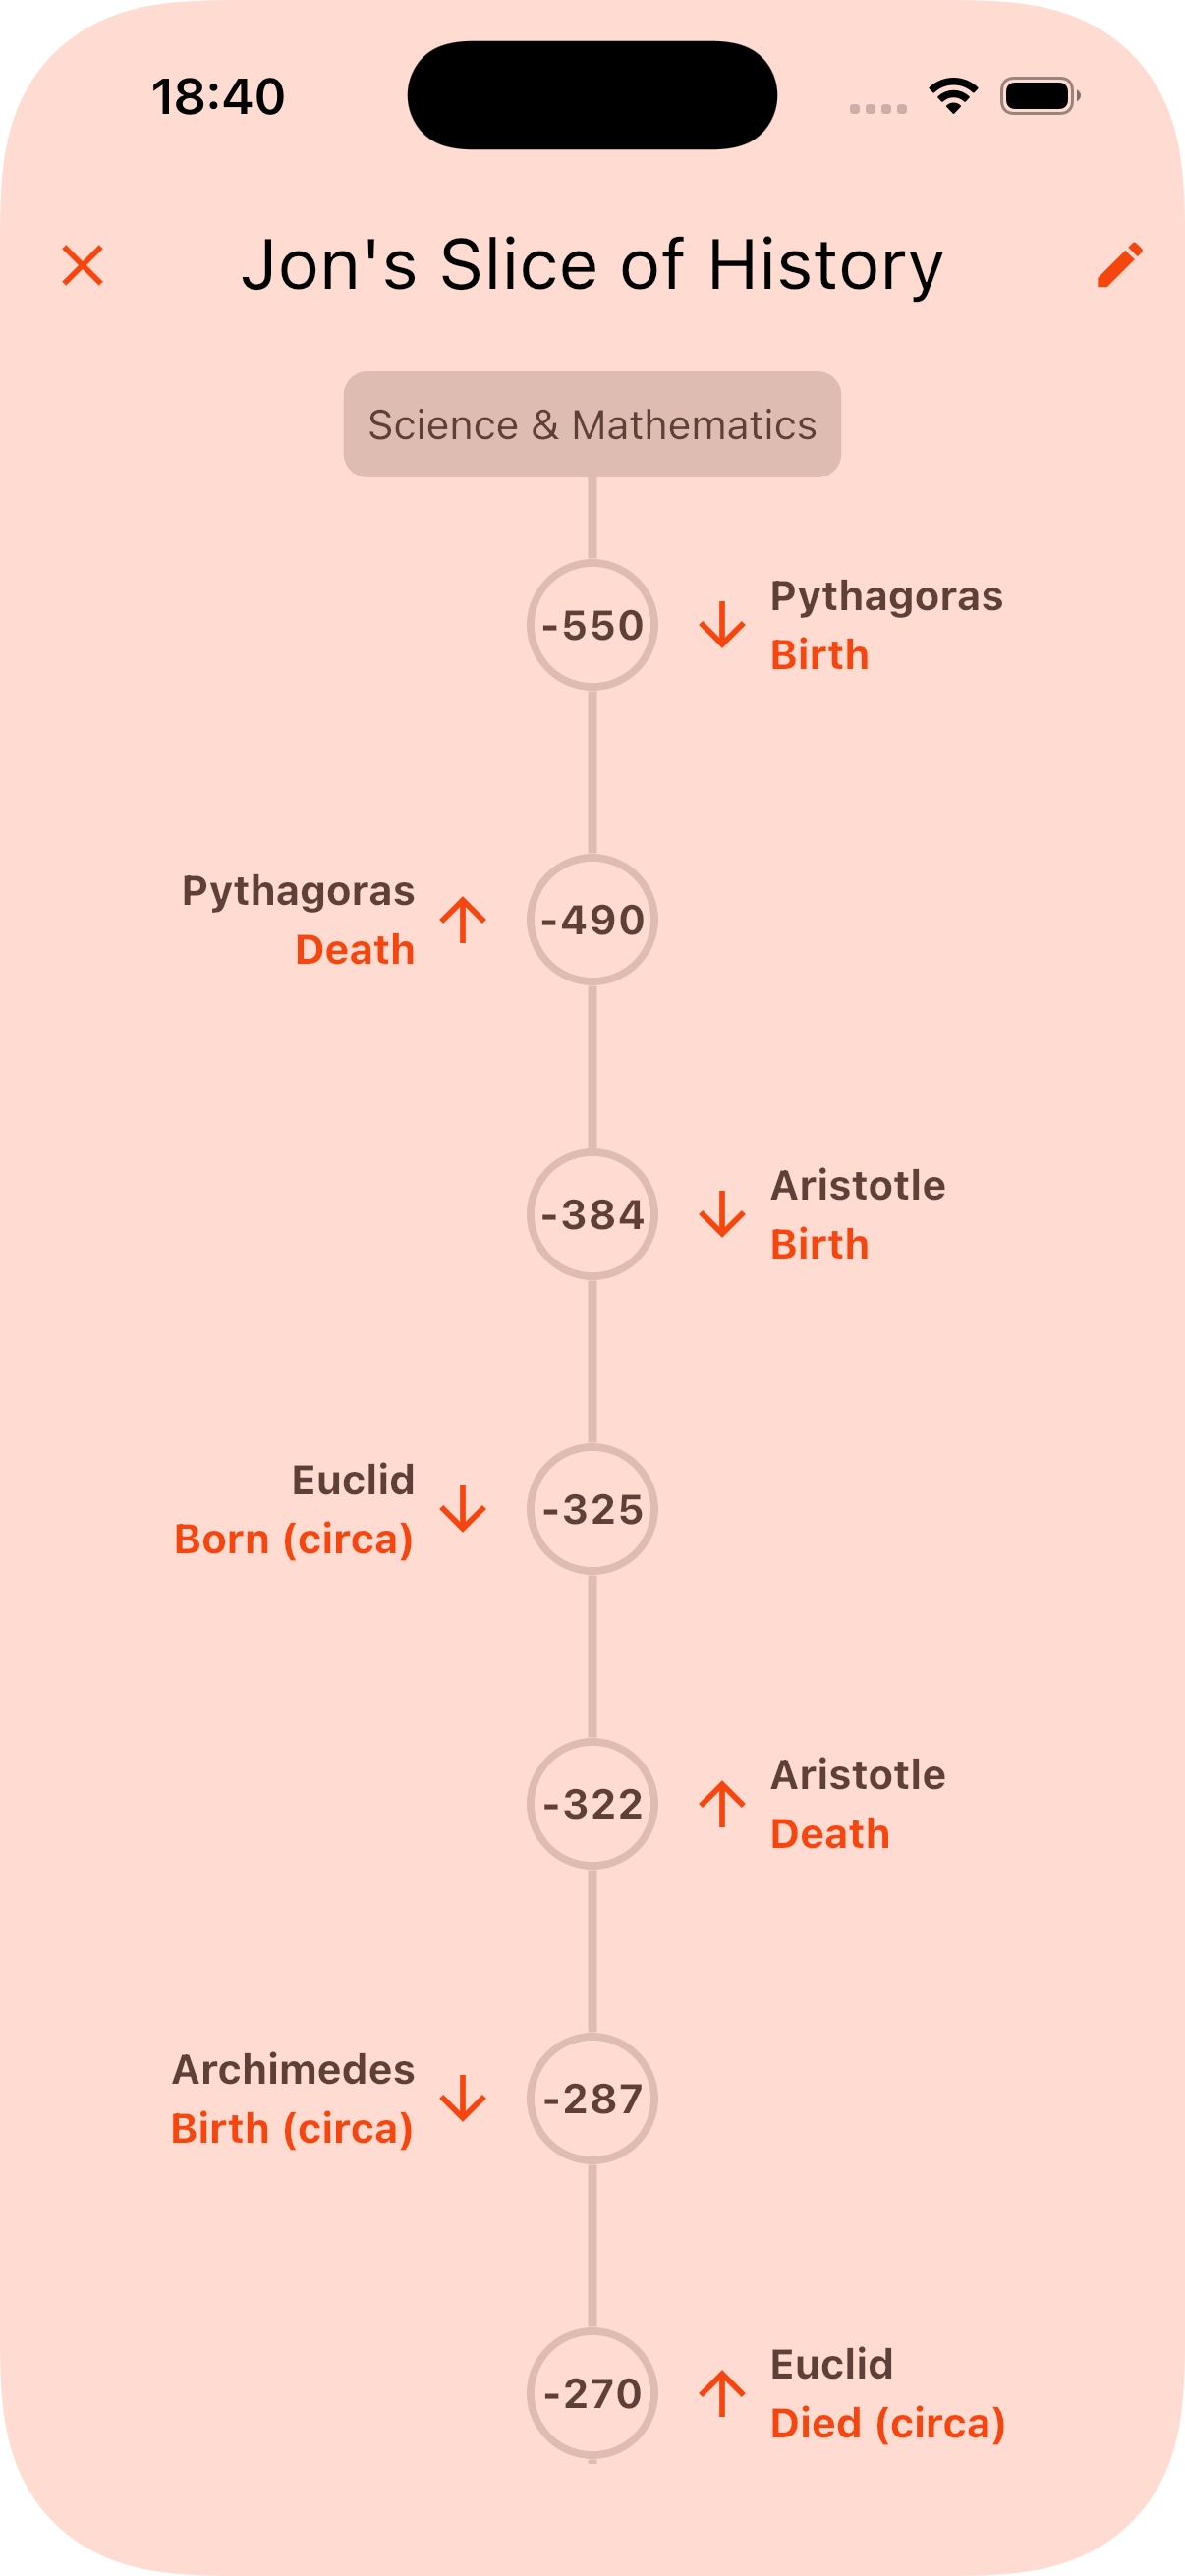
See the Timeline Shape
Use visual exploration to build intuition, then convert that intuition into durable recall.
How TimeToTime Helps You
TimeToTime visual tools help students build chronological awareness that feeds directly into inquiry.
- Timeline views let you step back and get a big-picture feel for an era.
- Folders let you learn multiple decks together for side-by-side comparison.
- The Link feature turns visual observations into explicit causal interplay maps.
- Contextual and exact-year prompts convert intuition into durable retrieval.
Takeaway
Visualisation is not just a fancy extra. It is a practical route to stronger historical judgement and memory.